As Opening Day approaches, diamond devotees are dusting off copies of The Baseball Encyclopedia and refreshing their memories on the sport’s hallowed statistical records: batting average, home runs, runs batted-in, and the like. Turn on a ballgame nowadays, though, and you’re likely to see another stat prominently featured on the broadcast screen: OPS.
Shorthand for “on-base percentage (OBP) plus slugging percentage (SLG),” OPS is meant to provide a more comprehensive understanding of a hitter’s contributions. Its now-widespread acceptance is a byproduct of the baseball statistics revolution, the analytical tide change that shifted focus away from the traditional numbers and towards “advanced” stats that correlate more with actual scoring. The modern approach, chronicled in Michael Lewis’s Moneyball, was one of the keys to the Oakland Athletics’ success in the early 2000s. OPS is now the baseball fan’s signifier of statistical savvy.
The problem? OPS makes no statistical sense.
Finally, a reason to check your email.
Sign up for our free newsletter today.
OPS’s components are individually useful. On-base percentage (times reaching base over plate appearances) tells you how often a hitter avoids making an out. Log a high-enough team OBP, and you’re sure to win a lot of games.
Slugging percentage (total bases over at-bats) augments the traditional batting average statistic by incorporating the number of bases gained per hit. It’s an important number, because slugging creates runs more quickly than slapping a lot of singles. The stat doesn’t count walks, hit by pitches, and sacrifices.
When summed, though, OBP and SLG obscure more than they illuminate. By mushing the two together, wannabe statisticians are combining unlike terms and thereby double-crediting the batter with the first base attained on any hit. Thus, doubles, triples, and walks are slightly undervalued in OPS, while singles are overvalued.
A better, simpler way to synthesize the skills of getting on base and hitting for power is to add all the bases a batter earns (via hit, walk, or hit by pitch) and divide that number by total plate appearances. I call this idea “batter’s average bases earned”—BABE.
Like its namesake, BABE doesn’t feign complexity. It’s sturdy, straightforward, and gives fans a new and easy way to think about the big picture of batting.
BABE’s chief virtue is that it compares all plate-appearance outcomes on equal terms: How many bases do you earn per time in the batter’s box? Getting on base in and of itself is a good thing, but getting two bases (or three or four) should be taken fully into account. BABE does that; OPS doesn’t.
Looking at real-world examples shows how BABE offers an improvement over OPS. Take Ichiro Suzuki, the twenty-first century’s greatest contact hitter to date. While undoubtedly an outstanding ballplayer, he benefited greatly from the singles bias in OPS, confounding fans who thought they were judging him on an “advanced” basis.
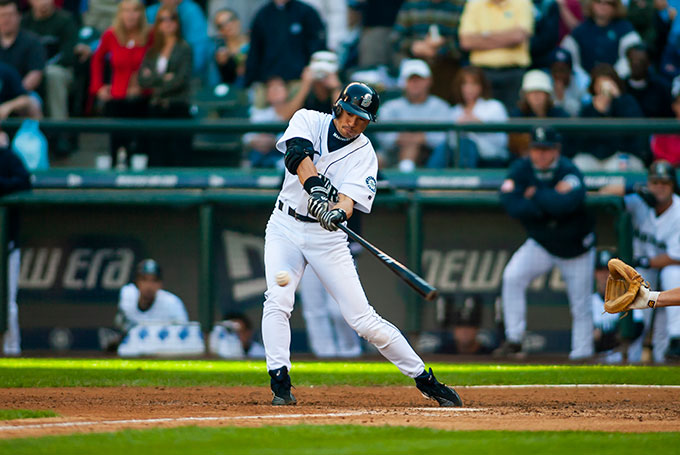
The 2004 season was the best of Ichiro’s remarkable career—better even than his Rookie of the Year/MVP debut in 2001. In 2004, the Mariners’ right fielder set the MLB record for hits, 262, and racked up an OPS of .869, his career high. Yet using BABE, this soon-to-be Hall of Famer was bested that season by two less-heralded outfielders: Andruw Jones and Johnny Damon.
For Jones, 2004 was a bit of a down year, with 29 home runs, his lone season in a seven-year stretch with fewer than 30. He turned in an OPS of .833 over the campaign. Damon hit leadoff for the legendary curse-breaking Red Sox that season, belting 20 homers for an OPS of .857.
Despite Ichiro’s better OPS, his BABE of .490 was significantly lower than Damon’s .533 and Jones’s .545. In fact, Ichiro was closer in BABE to that year’s MLB average, .476, than to his fellow stars.
Ichiro’s steady output of singles was certainly a huge achievement that season. But through the duplicate-credit problem, OPS imputed more potency to his offense than was justified.
For another example of how BABE can subtly change impressions, consider Barry Bonds. In the early 2000s, Bonds put up the most eyepopping OPS numbers ever seen. But even then, BABE illuminates his dominance more succinctly and accurately.
While fans remember Bonds’s 73-home run 2001 season as the apex of the McGwire-Sosa-Bonds homer binge, fans in-the-know will often cite 2004 as his best campaign. That year, he set all-time records for both walks and on-base percentage, while slugging at a top-ten all-time rate. As a result, he set the record for OPS (1.422) despite slugging a bit less than in 2001.
BABE reframes 2001 as Bonds’s greatest season. While he recorded a BABE of .882 in 2004—territory unreached by any other player in the modern game—in the 73-home run season he earned more bases per plate appearance, setting the BABE record at a stratospheric .899.
Popular media hold up OPS today as the thinking fan’s stat. In reality it’s sloppy. Advanced stats of a genuinely sophisticated nature have a rightful place in front-office analysis, but aren’t accessible to regular fans.
BABE, by contrast, is clean, clear, and can be tallied up in your head while watching a game. And since you’re probably curious, Babe Ruth’s own best season came in 1920, when the Bambino delivered a performance unlike anything the game had yet experienced: 54 dingers and a BABE of .877.
Top Photo: Shohei Ohtani batting for the Los Angeles Dodgers in the major league season opener in Japan on March 18, 2025 (Photo by Masterpress/Getty Images)
Source link